Detail investigation of VFB stack with a focus on single cell

Introduction

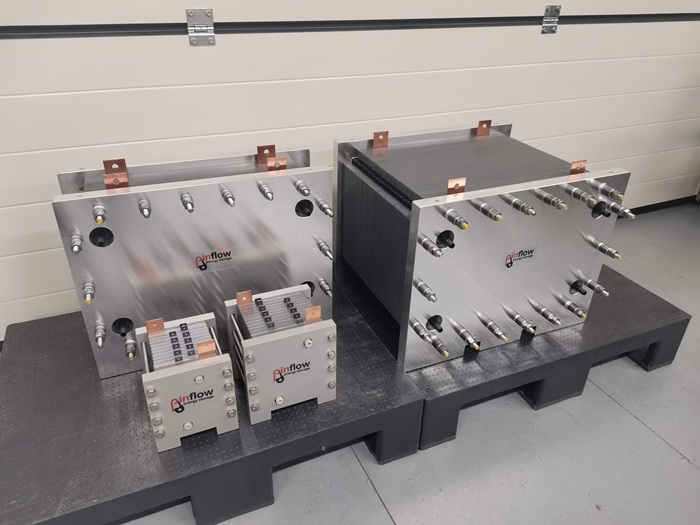
The battery stacks are the main components of the VFB and are mainly responsible for the performance and efficiency of the VFB.

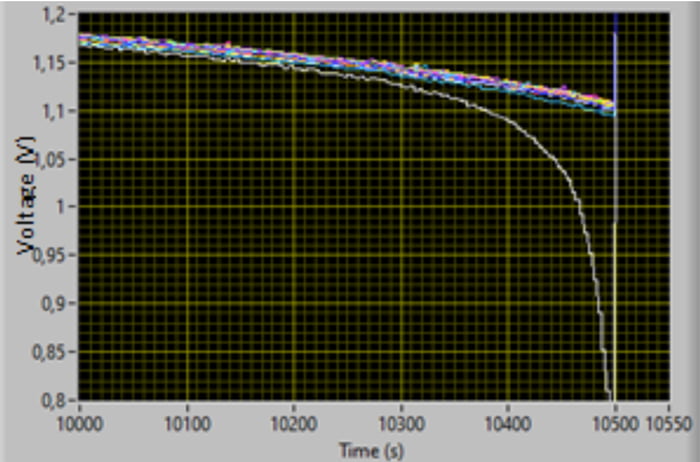
VFB stacks are usually composed of dozens of single cells that are electrically connected in series while hydraulically in parallel. Thus, battery performance is significantly affected by every single cell and a problem with even only one single cell could completely destroy the battery stacks if a parasitic reaction (oxygen evolution) occurs. The standard battery stack can be monitored only on the current collectors, and each of these problems results only in the small increase in the resistance of the battery stack (higher or lower voltage during charging/discharging) and it is not possible to distinguish whether there is some small problem homogenously distributed between all the cells or if there is a problem with only one cell. In the Pinflow research-grade stacks every single cell might be easily contacted and characterised. This arrangement enables us to develop an easy way to develop a reliable stack design with homogeneous distribution of the resistances.

Tested battery stacks
Figure 1: Examples of tested battery stacks
Laboratory apparatus for testing
Figure 2: Laboratory apparatus for testing of laboratory single cells and battery stacks (Laboratory test rig)
Kw-rig with the pilot stack with electrical contacts
Figure 3: Kw-rig with the pilot stack with electrical contacts on each individual cell

Methodology

  • In this work a comparison of different battery cells and stacks is presented. Direct comparison of single cell with active area of 20 cm2, through laboratory stack with active area of 20 cm2 to pilot scale battery stack with active area of 608 cm2 (Figure 1). For characterisation of the cells and stacks, EIS, load curves and simulated charging/discharging cycles were used.
  • Laboratory experiments were conducted in the tempered laboratory boxes and for characterisation potentiostat from Kolibrik company was used. The figure of the apparatus is presented in Figure 2.
  • Experiments with research grade pilot stack were performed in the kW-rig system (Figure 3). For characterisation of the battery stack, MegaEIS (impedance measurements) from Kolibrik company and PSB power sources (load curves and simulated charging/discharging) were used.

Results

Characterisation of each individual cell helped us to find that in the older design of the Pinflow stack there was a problem with the end cells of the battery stack. The results presented in Figure 4 show that the ohmic resistance of the end cell was nearly double compared to the middle cells. This was really a crucial problem, as degradation of the end bipolar plate may lead to the contamination of the electrolyte from the current collectors. This finding led us to the change in the design of the battery stack, and it might be observed that in the new design of the Pinflow battery stack the resistances of the middle cell and the end cell are the same.

Comparison of resistances of the middle cell
Figure 4: Comparison of resistances of the middle cell and end cell for the old and new design of the battery stack
Comparison of the resistances of the laboratory single cell
Figure 5: Comparison of the resistances of the laboratory single cell and research grade pilot stack

In the Figure 5 a comparison of the resistance of the laboratory single cell with active area of 20 cm2 and the research grade pilot scale battery stack with active area of 608 cm2 is presented. The resistance of the laboratory single well corresponds to the resistance of the battery stack and thus, great reproducibility between individual products might be presented.

Interesting and important information is possible to obtain even without the EIS measurement just from simulated charging/discharging cycles. In Figure 6 is presented the end of the discharging cycle and it might be observed that the voltage of one of the cells (middle) decreases much faster than that of the other cells, indicating some problems with the flow of the electrolyte within this cell. These results might provide important insight into the stack and also quantify influence of quality control mistakes in stack assembly on the overall performance. For example, if some trend would be observable between the individual cells or if it is an error caused during the stack assembly as it was simulated in this case.

Conclusion

Within this work, we are presenting advantages of the battery stack design that enables to contact and characterise each individual cell. This approach has great benefit during the design process and even for quality control purposes.

Course of the voltages of the individual cells
Figure 6: Course of the voltages of the individual cells at the end of discharging cycle